STACK OVERFLOW DEVELOPER SURVEY 2025 PUBLIC RESEARCH BRIEF
EXECUTIVE SUMMARY
Work mode, education, and developer pay.
A clear view of the salary differences in the 2025 developer survey, with uncertainty and survey limitations kept in view.
REMOTE PREMIUM IN THIS SAMPLE$16.9khigher mean than hybrid
WORK-MODE TESTp = .0096pooled two-sample t-test
EDUCATION TESTp < .001three-group ANOVA, US & Canada
WHAT THIS MEANS
Remote respondents report higher pay than hybrid respondents, and average pay differs across the three education groups. These are survey associations—use them to frame questions for your hiring policy, not as evidence that changing work mode or credentials will cause a pay change.
01 / SURVEY LANDSCAPE
Understand the workforce before comparing it.
Three exploratory views show where salary and satisfaction vary. Open any chart for a closer look.
20,407cleaned survey rows
$77,730overall median salary
7.19 / 10average valid job satisfaction
33.6mmaximum salary in USD; note the skew
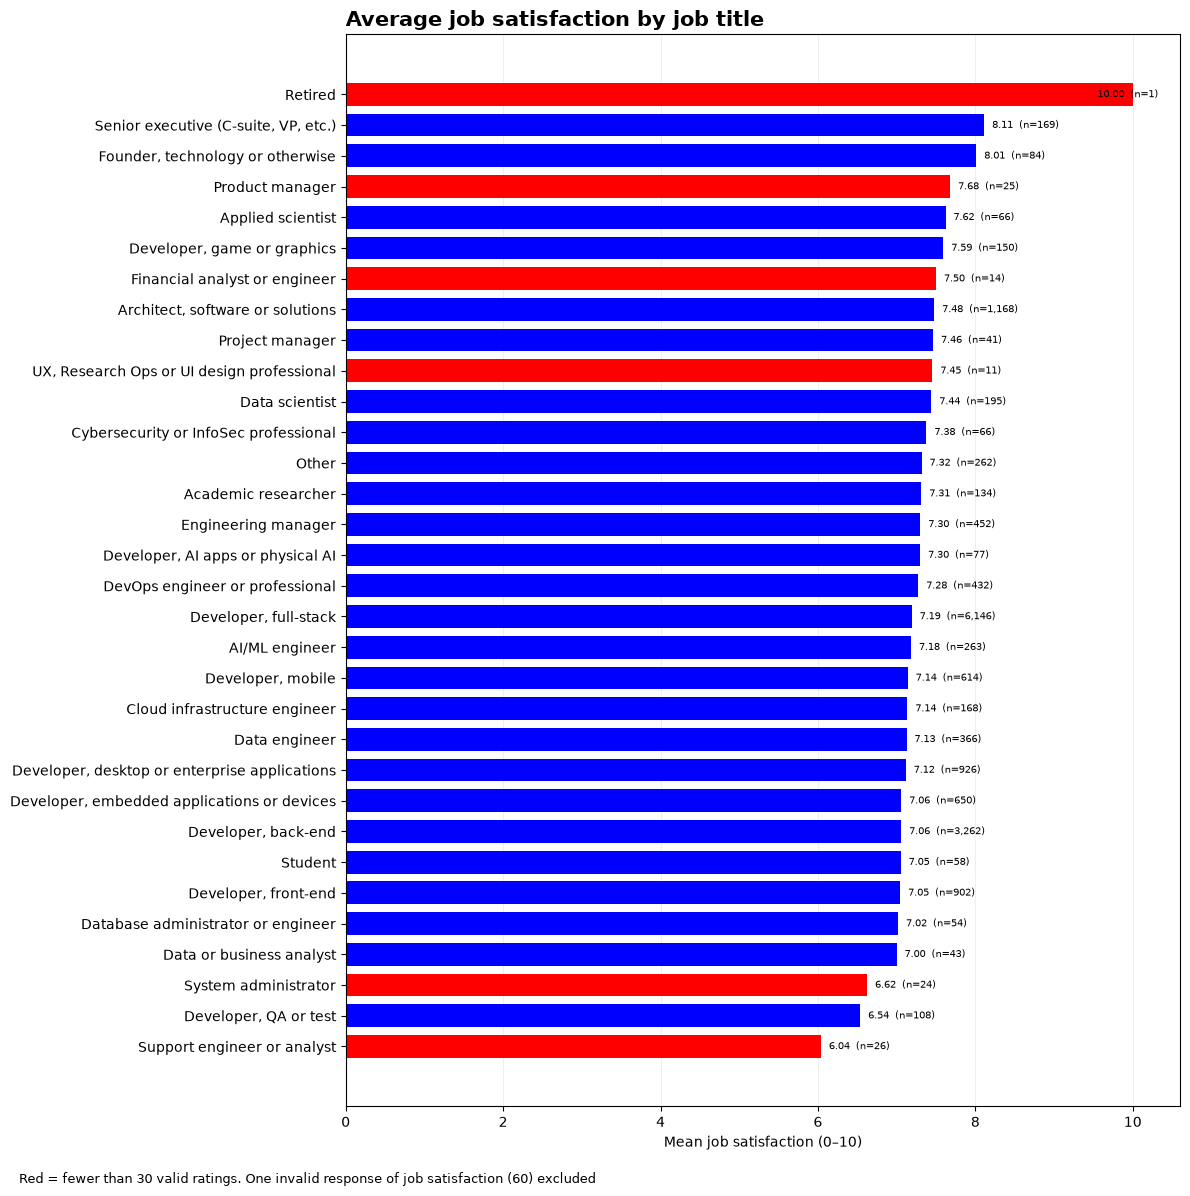
FIGURE 01
Job satisfaction by title
Most title averages cluster together. Groups with fewer than 30 valid ratings are flagged in red, so small samples are not overread.
One response of 60 is outside the 0–10 satisfaction scale and is excluded from this figure only.
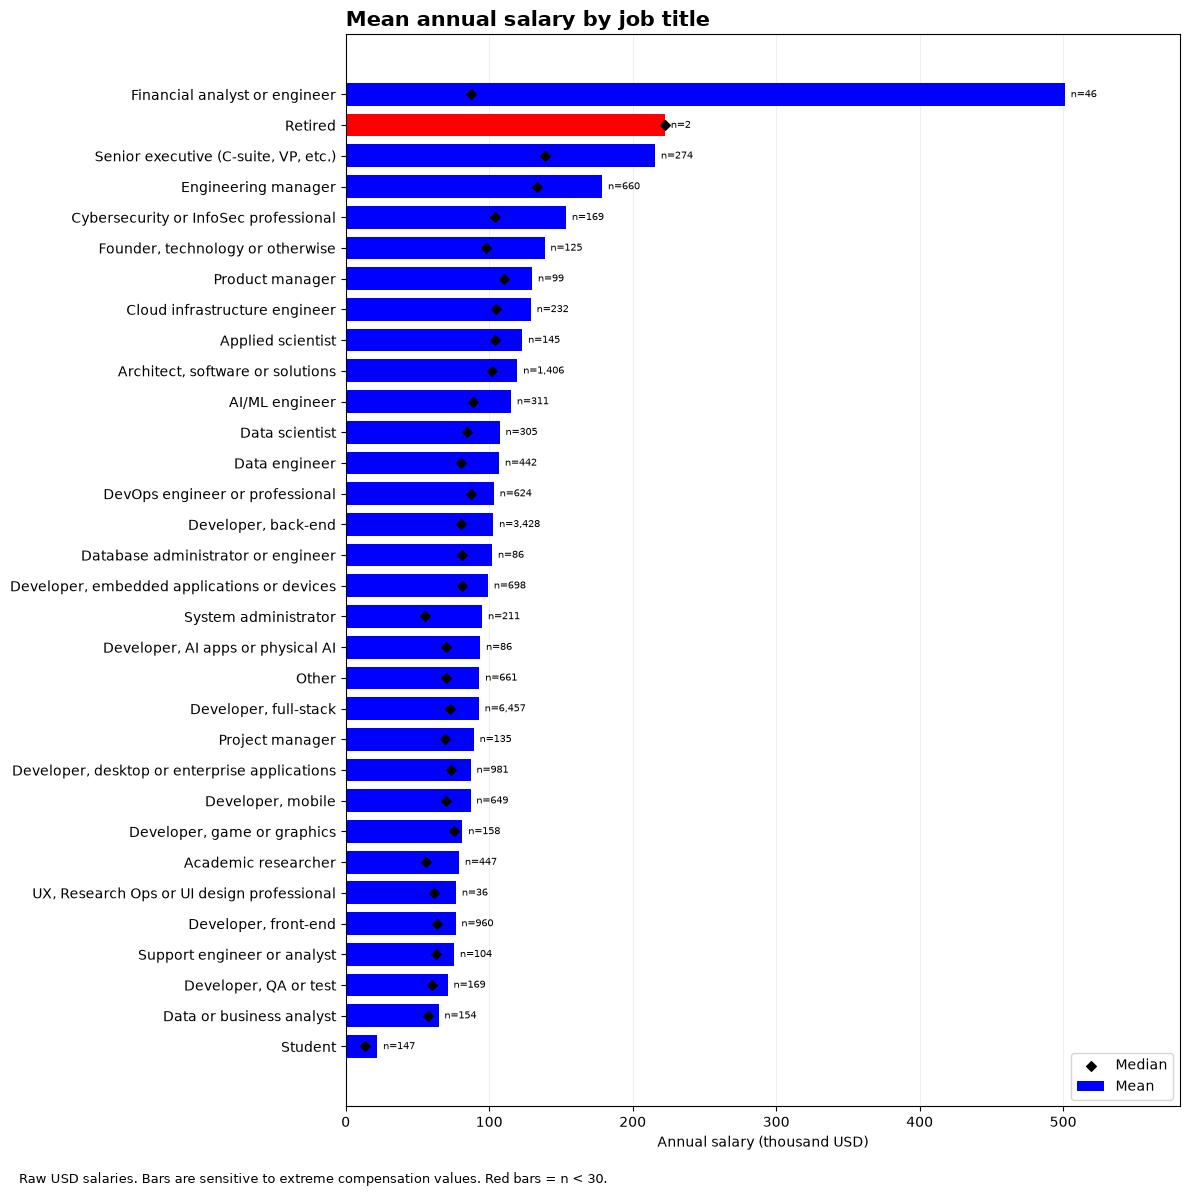
FIGURE 02
Salary by job title
Bars show mean salary; diamonds show the median. The gap reveals how exceptionally high salaries can pull a mean upward.
Red bars indicate fewer than 30 salary responses. Explore exact values below.
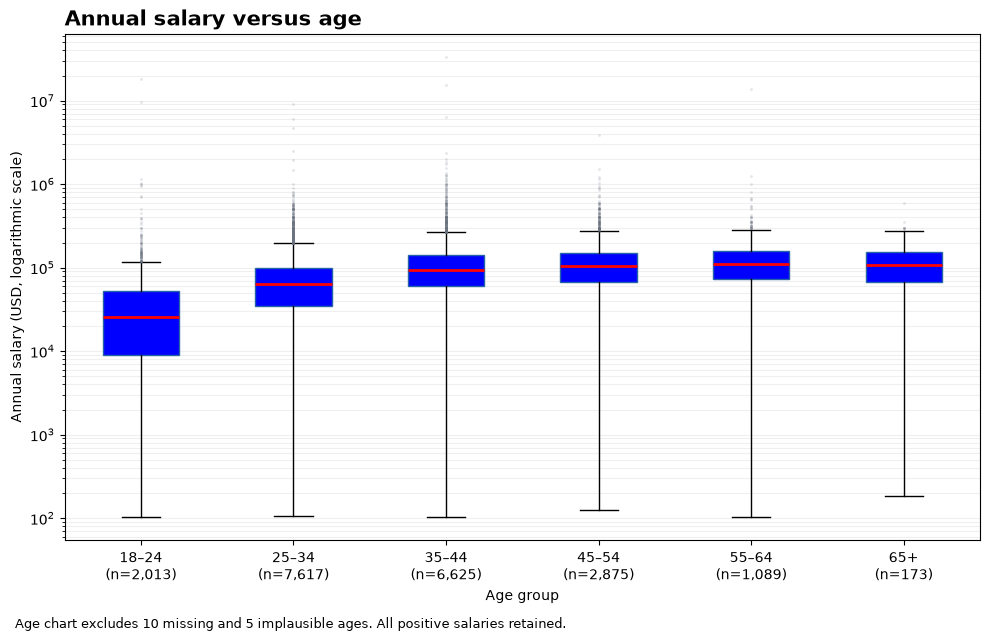
FIGURE 03
Salary across age groups
Median salary rises from $25,573 at ages 18–24 to about $110,000 at ages 55–64. The oldest group is much smaller, and every age group contains a wide spread of salaries.
18–24 → 55–64$25.6k → $110kgroup medians, not a causal age effect
Age chart omits 10 missing and 5 implausible ages. Salaries remain untrimmed.
EXPLORE THE AGGREGATES
Look up a job title
02 / WORK MODE
Remote salaries lead in this sample.
Hybrid and remote responses are compared using the same annual USD salary measure throughout.
HYBRID$101,790mean annual salary · n = 7,803
Median $77,730
vs
REMOTE$118,684mean annual salary · n = 6,934
Median $90,527.50
↗ Remote respondents average $16,893.50 more than hybrid respondents. Both medians point in the same direction.
DESCRIPTIVE STATISTICS
What sits behind the averages
Work mode
n
Mean
Median
Std. dev.
25th pct.
75th pct.
99th pct.
Maximum
Hybrid
7,803
$101,790
$77,730
$347,265
$47,566
$116,015
$400,000
$18,387,548
Remote
6,934
$118,684
$90,527.50
$442,810
$47,650
$150,000
$500,000
$33,552,715
Large maxima and standard deviations signal heavy right tails. The main analysis keeps all positive salaries; excluding salaries above the pooled 99th percentile ($450,000) as a sensitivity check still leaves remote ahead by $14,582.13.
MEAN COMPARISON
Two methods, same t statistic
t = −2.5907
Manual pooled calculation and SciPy's built-in test agree to numerical precision. With 14,735 degrees of freedom, both give p = 0.00958682.
Welch's unequal-variance testp = 0.01064344
Brown–Forsythe variance checkp = 0.016538
See the manual calculation
Hybrid variance = 120,592,867,982.18; remote variance = 196,080,623,864.35. The pooled standard deviation is $395,108.58 and the standard error of the mean difference is $6,520.76. Dividing −$16,893.50 by that standard error gives t = −2.590726. The two-sided p-value is 0.00958682.
UNCERTAINTY
Both 95% intervals exclude zero
Formula-based, pooled t−$29,675 to −$4,112
Bootstrap percentile−$30,753 to −$4,685
Both intervals describe hybrid minus remote. Negative values mean the remote group reports more. Their endpoints differ because the bootstrap reflects the observed skew.
Null-centered bootstrap t-testp = 0.00550
10,000 BOOTSTRAP REPLICATIONS
Explore the sampling distributions
Each resample preserves its group's size.
A SECOND LENS
The median comparison agrees.
Mood's median test compares counts above and below the pooled median ($81,912). Its p-value is 1.396 × 10⁻²⁵. A centered bootstrap test of the median difference gives p = 0.000100; its 95% interval is −$16,242 to −$10,000 for hybrid minus remote.
MEDIAN DIFFERENCE−$12,797.50Hybrid − Remote
The two median p-values are not numerically close because the tests use different statistics and the 10,000-replication bootstrap cannot resolve p below about 0.0001. Both support a difference. A small p-value is evidence against equal group means or medians under the test assumptions; it is not the probability that the null hypothesis is true.
03 / EDUCATION
Pay differs across education groups.
This comparison is limited to survey participants in the United States and Canada.
BACHELOR’S$160,988mean · n = 2,978
Median $140,000
MASTER’S$182,220mean · n = 1,084
Median $157,000
PROFESSIONAL$197,701mean · n = 301
Median $160,000
ORIGINAL ANALYSIS
At least one group mean differs
F = 17.4966
One-way ANOVA: F(2, 4360), p = 2.70 × 10⁻⁸. This rejects the hypothesis that all three population means are equal, but does not identify every differing pair.
Welch ANOVAp = 6.16 × 10⁻⁶
Variance checkp = 1.99 × 10⁻⁵
BOOTSTRAP CHECK
The finding persists on resampling
p = 0.00020
A null-centered, 10,000-replication bootstrap ANOVA also rejects equality at the 5% level. Unequal salary spreads and extreme values warrant care, but Welch ANOVA and a 99th-percentile sensitivity check reach the same overall conclusion.
Scope4,363 respondents
THREE EDUCATION BOOTSTRAP FIGURES
Explore group and pairwise uncertainty
Each education group is resampled at its original size.
PAIRWISE READOUT
Where the differences appear
Mean difference
Observed difference
Bootstrap 95% interval
Includes zero?
Bachelor − Master
−$21,232.87
−$32,381 to −$11,464
No
Bachelor − Professional
−$36,713.36
−$61,362 to −$15,862
No
Master − Professional
−$15,480.48
−$41,228 to $7,307
Yes
These percentile intervals are exploratory and not adjusted for multiple comparisons. A formal claim about specific pairs would need a multiple-comparison procedure.
04 / METHOD & CAVEATS
Read the evidence with its limits.
01
One survey, one source
All findings use the supplied cleaned Stack Overflow 2025 survey file. Figures and numbers mirror the accompanying analysis notebook. No individual-level dataset is published here.
02
High salaries remain visible
Large reported salaries create long right tails. The primary analysis retains positive values; 99th-percentile exclusions are sensitivity checks only.
03
Independent respondents assumed
The tests assume independent survey responses. The survey file does not establish a randomized sample or prove independence, and unequal variances are indicated in both comparisons.
04
Association, not causation
Country, occupation, experience and other factors may affect salary. The analyses compare reported groups; they cannot establish the effect of changing work policy or education.